
Create your own 5 day data scroller for NDBC spectral data.
You may use this freely without reference for whatever non-commercial purpose you want. Fight the status quo!
Code below!
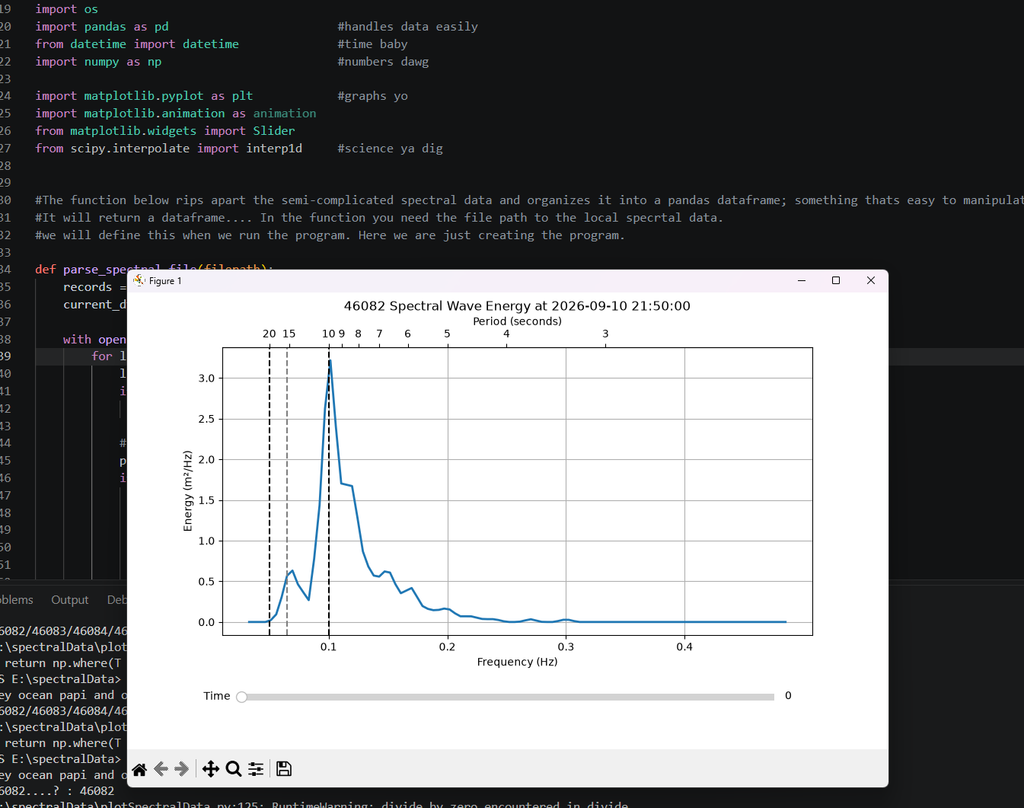
Steps:
- Download Python3
- Create local directory (create a folder in your computer) called “Spectral Data”
- Inside that folder create another folder called “ndbc_spectral_data”
- In the parent folder “Spectral Data” cut and copy the python code below and save as main.py
- Go to NDBC Spectral Analysis page for the buoy you want
- Example for 46082 : https://www.ndbc.noaa.gov/data/5day2/46082_5day.spectral
- Cut and copy the spectral data into a notepad document. Save that as <buoy>.txt in the “ndbc_spectral_data” folder
- Example, for 46082 I would save the text file as “46082.txt”
- Run the main python program!
Directory Structure..
-> Spectral Data
       -> ndbc_spectral_data
             -> <buoy>.txt
   main.py
"""
Author: Ya boi Andy
Date: 9/15/2026
Purpose:
Interactive plot for buoys in the Gulf of Alaska and off Hawaii
This plots buoy data saved locally from "downloadOPC_data.py"
When you run the main program, it will ask you what buoy you would like to plot.
The current buoys are
buoys = [46082] #you can add more, just separate with commas
"""
#These import functions act like tools in a garage. Ya sure you can build a quarter pipe with a saw...
#but why not just grab the right tools for the job? Makes your life easier
#so think of the 'import' as just grabbing prededfined tools to help make whatever project you're working on easy.
import os
import pandas as pd #handles data easily
from datetime import datetime #time baby
import numpy as np #numbers dawg
import matplotlib.pyplot as plt #graphs yo
import matplotlib.animation as animation
from matplotlib.widgets import Slider
from scipy.interpolate import interp1d #science ya dig
#The function below rips apart the semi-complicated spectral data and organizes it into a pandas dataframe; something thats easy to manipulate.
#It will return a dataframe.... In the function you need the file path to the local specrtal data.
#we will define this when we run the program. Here we are just creating the program.
def parse_spectral_file(filepath):
records = []
current_dt = None
with open(filepath, "r") as f:
for line in f:
line = line.strip()
if not line:
continue
#parsing timestamp (YYYY MM DD hh mm bands)
parts = line.split()
if len(parts) == 6:
#timestamp line
try:
year, month, day, hour, minute, bands = parts
current_dt = datetime(
int(year), int(month), int(day), int(hour), int(minute)
)
except Exception:
current_dt = None
continue
#If current_dt is set, try parsing spectral band line
if current_dt is not None:
#Each spectral band line has 7 columns:
#freq bandwidth energy r1/r2/alpha1/alpha2
try:
freq, bandwidth, energy, r1, r2, alpha1, alpha2 = parts
record = {
"datetime": current_dt,
"freq": float(freq),
"bandwidth": float(bandwidth),
"energy": float(energy),
"r1": float(r1),
"r2": float(r2),
"alpha1": float(alpha1),
"alpha2": float(alpha2),
}
records.append(record)
except Exception as e:
#Could not parse spectral band line, skip
print(f"Skipping line due to error: {line}\nError: {e}")
continue
df = pd.DataFrame(records)
#print(df) #remove the '#' in front of print(df) if you want to see the actual dataframe
return df
#This creates a slider graph for the previous 5 days of buoy spectral data.
#we pass this function the dataframe and buoy id
def smooth_animation_with_slider(df,buoy_id):
df = df.sort_values("datetime")
times = np.array(sorted(df["datetime"].unique()))
freq_min, freq_max = df["freq"].min(), df["freq"].max()
freq_grid = np.linspace(freq_min, freq_max, 100)
interp_energies = []
for t in times:
subset = df[df["datetime"] == t]
f = interp1d(subset["freq"], subset["energy"], bounds_error=False, fill_value=0)
interp_energies.append(f(freq_grid))
interp_energies = np.array(interp_energies)
fig, ax = plt.subplots(figsize=(10, 6))
plt.subplots_adjust(bottom=0.25)
line, = ax.plot(freq_grid, interp_energies[0], lw=2)
ax.set_xlabel("Frequency (Hz)")
ax.set_ylabel("Energy (m²/Hz)")
ax.set_title(f"{buoy_id} Spectral Wave Energy at {times[0]}")
#manually defining 10s/15s/20s to quickly see swell vs fresh seas (for most cases)
ax.axvline(x=0.10, color = "black" , linestyle="--")
ax.axvline(x=0.065, color = "grey" , linestyle="--")
ax.axvline(x=0.05, color = "black" , linestyle="--")
if turn_yaxis_limt_on == True:
ax.set_ylim(0, manual_yaxis_lim)
ax.grid(True)
#Fix bottom x-axis ticks to these frequencies
ax.set_xticks([0.1, 0.2, 0.3, 0.4])
def freq_to_period(f):
return np.where(f > 0, 1 / f, 0)
def period_to_freq(T):
return np.where(T > 0, 1 / T, 0)
period_ticks = np.array([20, 15, 10, 9, 8, 7, 6, 5, 4, 3])
freq_ticks = period_to_freq(period_ticks)
valid_mask = (freq_ticks >= freq_min) & (freq_ticks <= freq_max)
freq_ticks = freq_ticks[valid_mask]
period_ticks = period_ticks[valid_mask]
#Re-set in case this overrides freq_ticks
ax.set_xticks([0.1, 0.2, 0.3, 0.4])
secax = ax.secondary_xaxis('top', functions=(freq_to_period, period_to_freq))
secax.set_xlabel('Period (seconds)')
secax.set_xticks(period_ticks)
ax_slider = plt.axes([0.15, 0.1, 0.7, 0.03])
slider = Slider(ax_slider, 'Time', 0, len(times) - 1, valinit=0, valstep=1)
def update(val):
idx = int(slider.val)
y = interp_energies[idx]
line.set_ydata(y)
ymin, ymax = y.min(), y.max()
padding = (ymax - ymin) * 0.1
if turn_yaxis_limt_on == True:
ax.set_ylim(0, manual_yaxis_lim)
else:
ax.set_ylim(max(0, ymin - padding), ymax + padding)
ax.axvline(x=0.10, color = "black" , linestyle="--")
ax.axvline(x=0.065, color = "grey" , linestyle="--")
ax.axvline(x=0.05, color = "black" , linestyle="--")
ax.set_title(f"{buoy_id} Spectral Wave Energy at {times[idx]}")
fig.canvas.draw_idle()
slider.on_changed(update)
plt.show()
#Usage:
#------------------------------------------------------------------------------
"""
Define...
turn_yaxis_limt_on #Set this to True or False
True means it will enable the y axis to have a set limit so you can analyze data better
False means the y limit limit will be disabled and will default to whatever data you pass it
manual_yaxis_lim = YY.YY
change manual_yaxis_lim to whatever float (number with decimals) you would like. It can be 1,
it can be 100... it can be 50.5. This just allows you to focus the y limit
"""
turn_yaxis_limt_on = False #True or False
manual_yaxis_lim = 0.5 #whatever float (number with decimals) you want
#------------------------------------------------------------------------------
print("Hey ocean papi and or senorita, what buoy do you want to check?")
buoy = input("46082....? : ")
saveDir = f"{os.getcwd()}/ndbc_spectral_data"
#parse information in file and turn into dataframe
spectral_df = parse_spectral_file(f"{saveDir}/{buoy}.txt")
#create slider
smooth_animation_with_slider(spectral_df, buoy)
Some notes…
You may ask why I don’t automate the download process. The answer is simple. I don’t want to give that tool to someone who doesn’t necessarily understand the correct etiquette for requesting data from public sources.
To simply explain….
Imagine if your doorbell rang every 30 seconds from a stranger. Eventually you would rip the doorbell out and install a large fence.
When we request data online, we are essentially ringing a doorbell for the webserver to hand us data. In small purposeful requests this is fine…
We request the data, store it locally, and mess with it locally… leaving the server alone.
So once you understand python a bit more feel free to write a script that pulls data. Just be sure to make purposeful requests. Call for data once. Store it locally.